
How do people read maps that show sound? And what happens when those maps contain uncertainty - like when a quiet park seems loud or a busy train station appears calm?
A research team from the University of Augsburg, University of Salzburg, and FHNW Switzerland set out to find out. Their study (2025) focused on how users interpret uncertainty in environmental noise models: visual maps that show road traffic noise across cities.
To make the study widely accessible, they ran it completely online using RealEye webcam-based eye tracking. This allowed them to observe people’s visual attention remotely - across laptops, tablets, and smartphones - without the need for lab equipment.
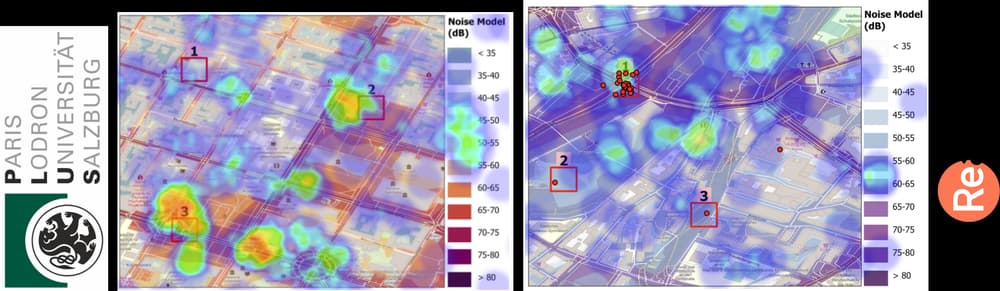
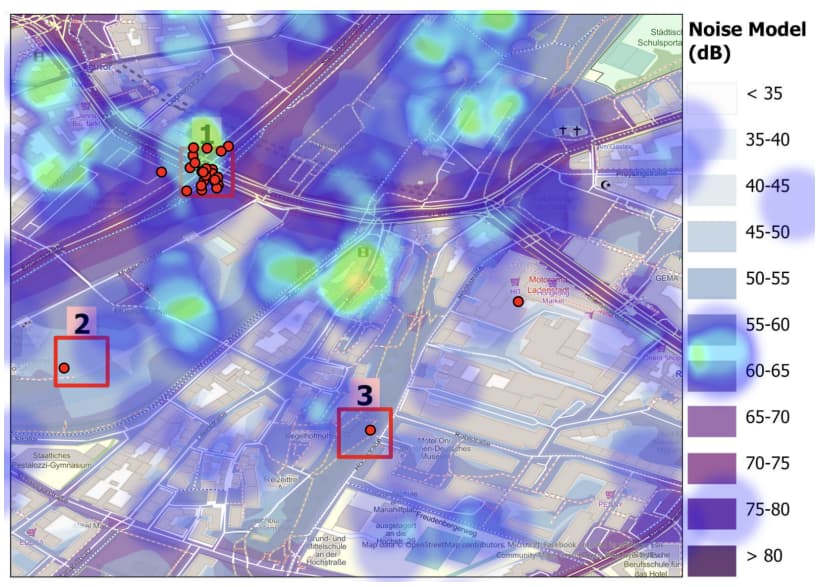
The team built a noise model of Munich using NoiseModelling, an open-source tool that simulates road traffic noise based on the EU’s CNOSSOS-EU framework. The maps only included traffic noise, not trains or industrial sources, to keep the model simple and controlled.
Then, 35 participants took part in the online experiment. Some joined during a cartography workshop, others participated later from home. They used their own devices - four on desktop, three on tablets, and most (28) on smartphones - to complete visual tasks involving noise maps.
Each participant viewed several map versions with different color schemes and noise level classifications, and completed tasks such as:
Throughout each task, RealEye tracked their gaze points, fixations, clicks, and facial emotions, creating detailed visual heatmaps of where attention clustered on the screen.
1. Attention follows expectations.
When asked to find noisy or quiet areas, most participants focused on what looked like noise sources - intersections, main roads, and dense neighborhoods. Even when the data showed otherwise, many still followed their assumptions.
2. Colors help, but less than expected.
Two different color schemes were tested - one from NoiseModelling and another from ColorBrewer. Accuracy stayed above 90% for both, suggesting that while color design matters, users rely more on spatial cues and prior knowledge.
3. We notice uncertainty - and it slows us down.
In maps where expectations and data didn’t match (for example, the central train station shown as quiet), users paused longer and explored more carefully. Their eyes moved more before deciding, showing how uncertainty increases cognitive effort.
4. Noise influences real-world choices.
When choosing where to live based on the noise map, nearly all participants selected quieter neighborhoods. The heatmaps clearly avoided noisy areas, confirming that perceived sound plays a strong role in spatial decision-making.
This study demonstrates more than just how we read maps - it shows how design, context, and technology shape human perception.
Key takeaways include:
This work lays a foundation for future cartographic UX studies. The team suggests that designing tasks and stimuli specifically for different devices - rather than using one layout for all - could improve both data quality and participant experience.
Ultimately, the study shows how webcam eye tracking can help researchers see how people see - revealing not just where they look, but how they think when faced with uncertain or complex information.

Follow the steps below to start your own experiment with RealEye:
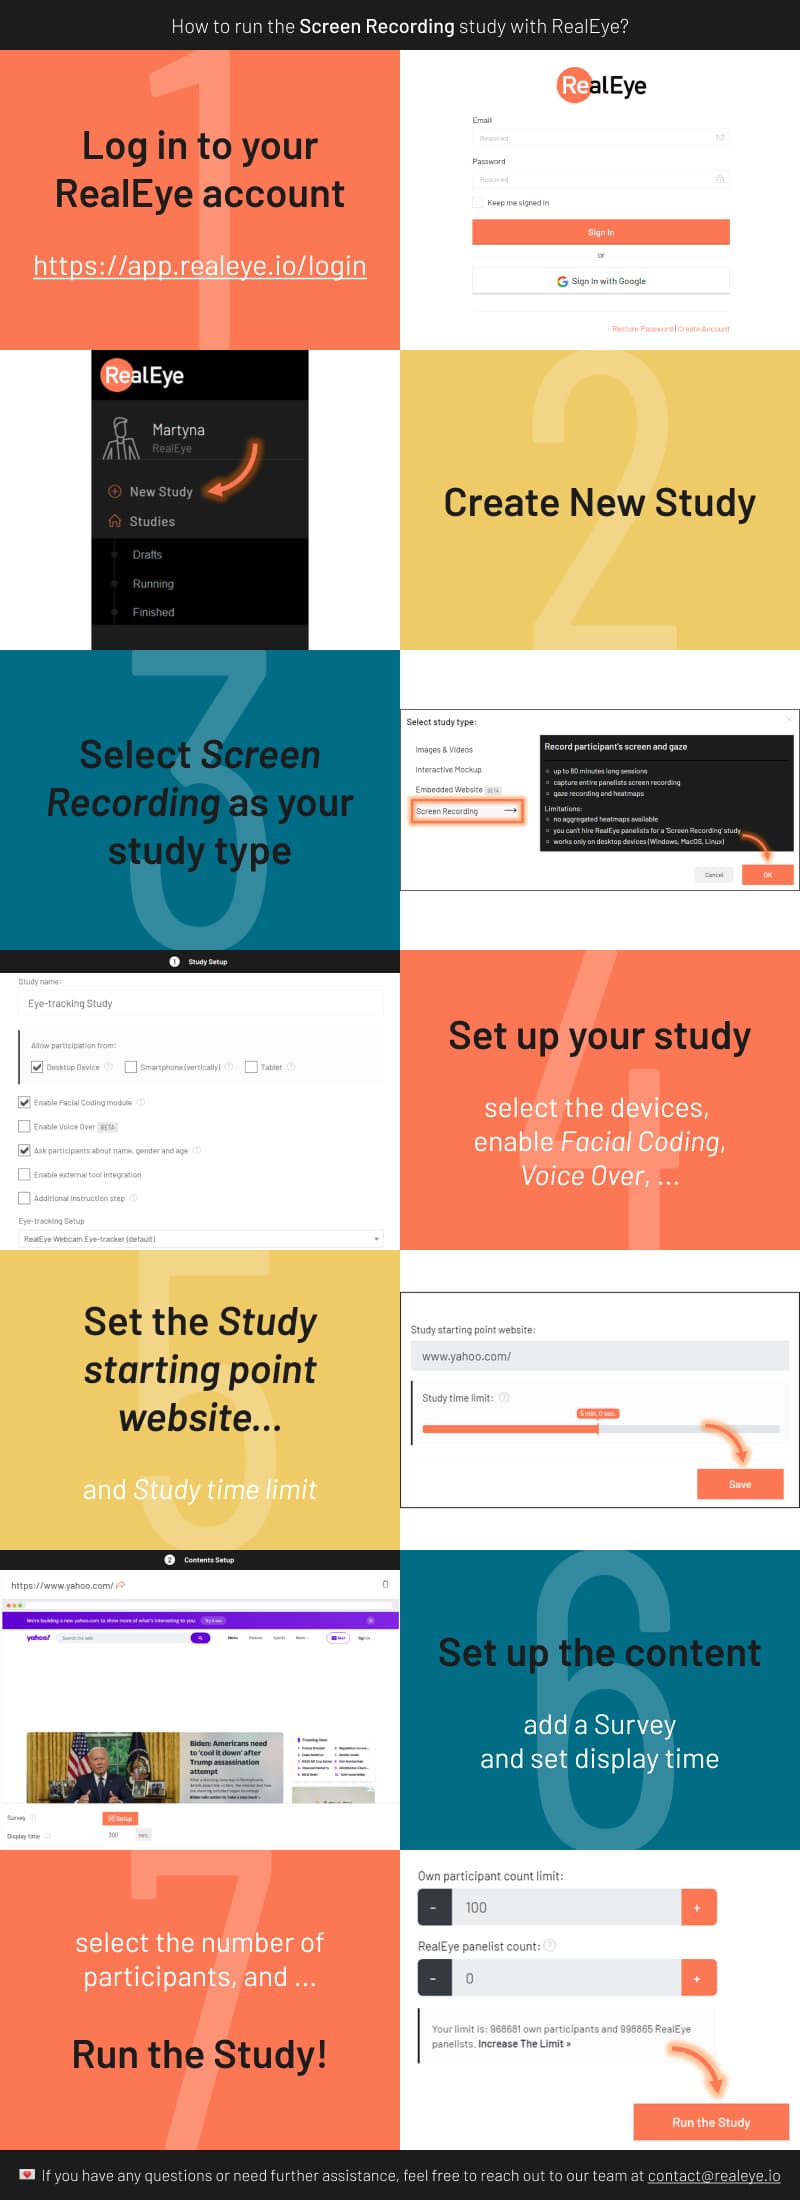
Ready to set up your own study? Visit RealEye Support page to learn more and keep us posted on your results! 🚀