
This study compares eye-tracking data collected from four device types completing identical RealEye tests. The objective is to answer the following questions:
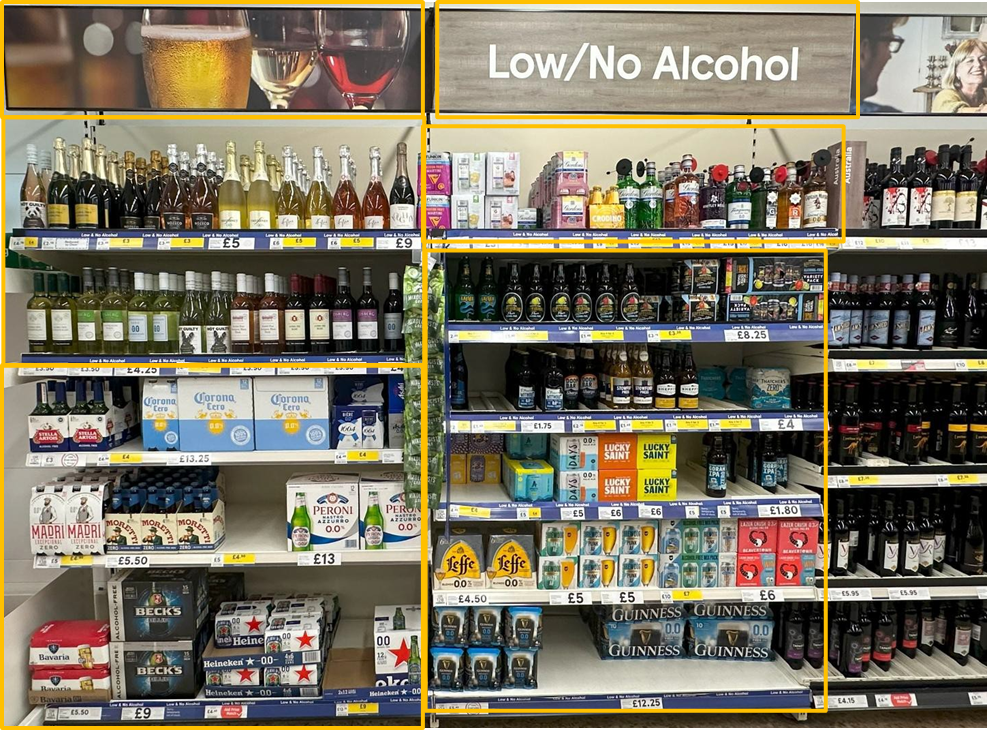
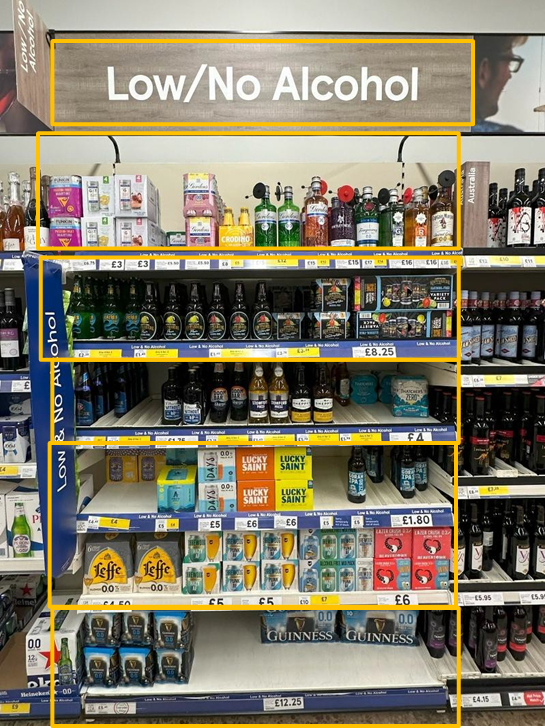
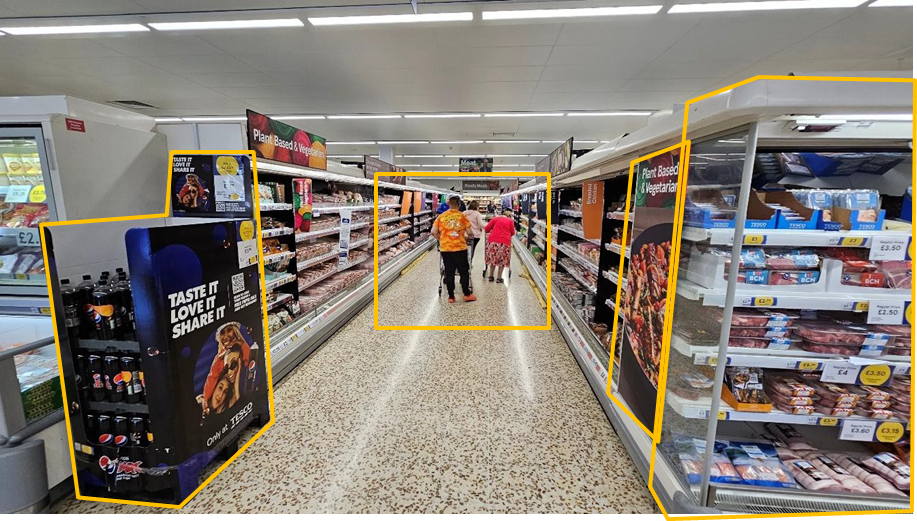
Hypothesis: Eye movement is largely subconscious and therefore unlikely to be meaningfully influenced by demographic or purchasingRealEye Device Comparison Test,realeye-device-comparison-test,65e0d4683a5682307f5b7629,67c2a1b3f4feecb026970001,false,fant use cases, three stimulus types were included. Each stimulus was tested across all devices (desktop/laptop, tablet, smartphone vertical, smartphone horizontal) and presented in both portrait and landscape formats where applicable.

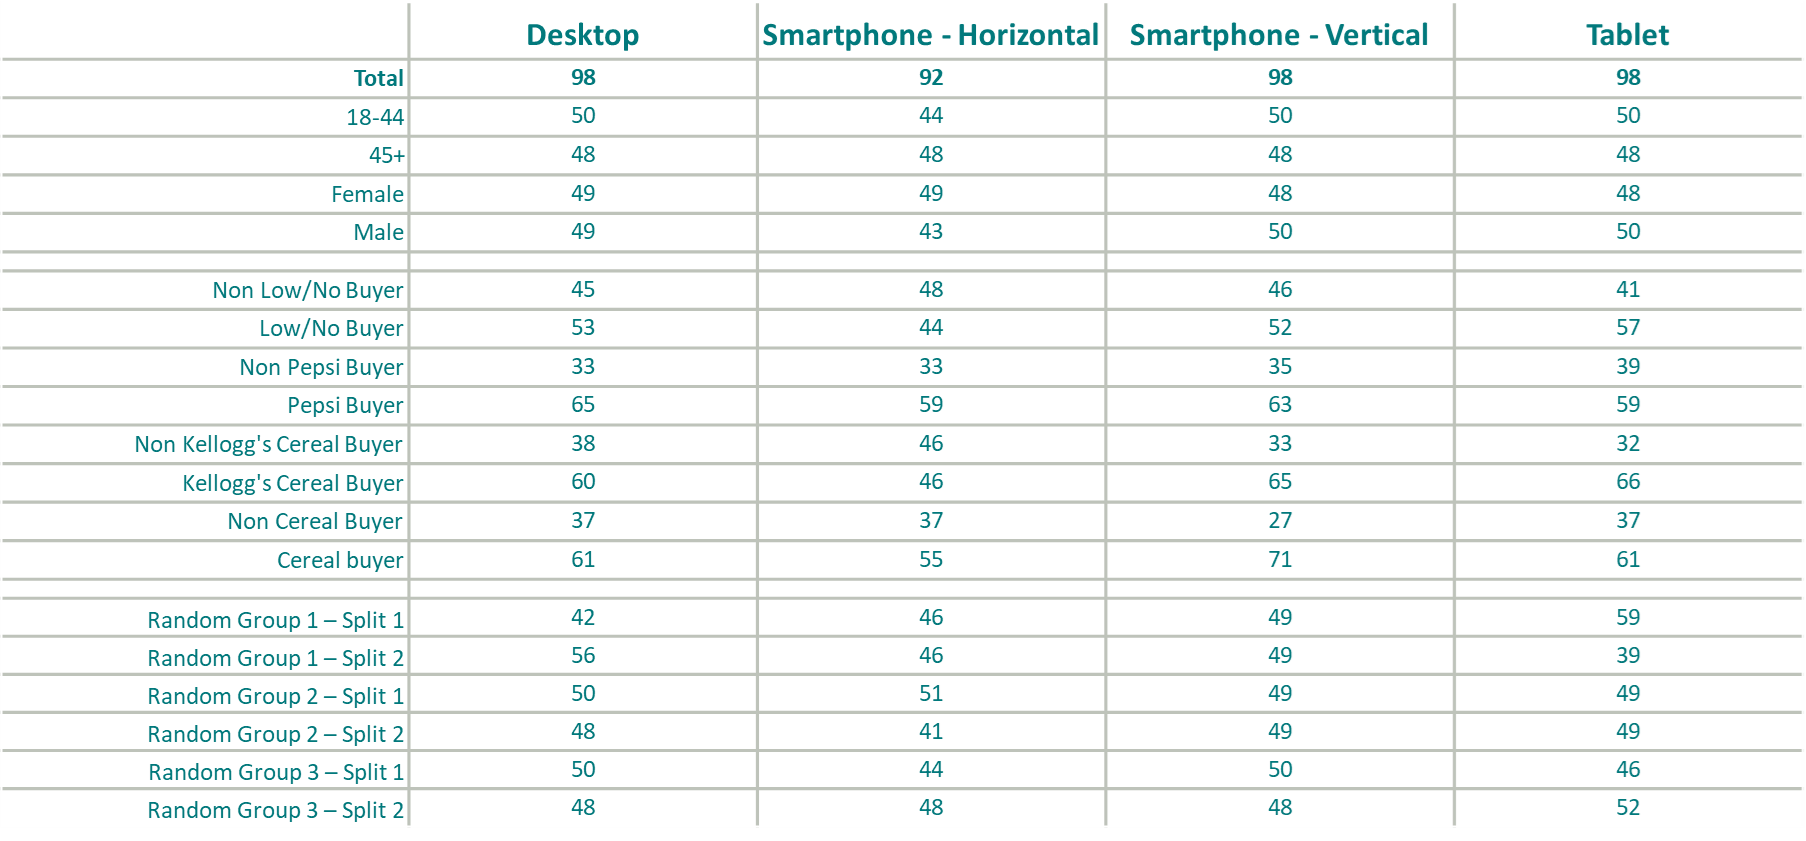
A total sample of n = 400 participants was recruited via Prolific and split evenly across four cells (n = 100 per cell). Age and gender were controlled to a 50/50 split within each cell. Responses with quality scores classified as Low or Very Low were excluded, in line with standard project procedures.
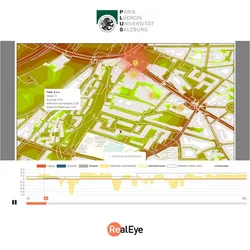
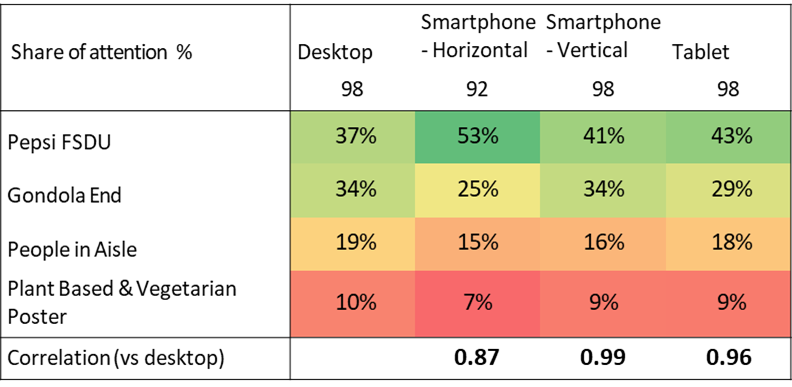
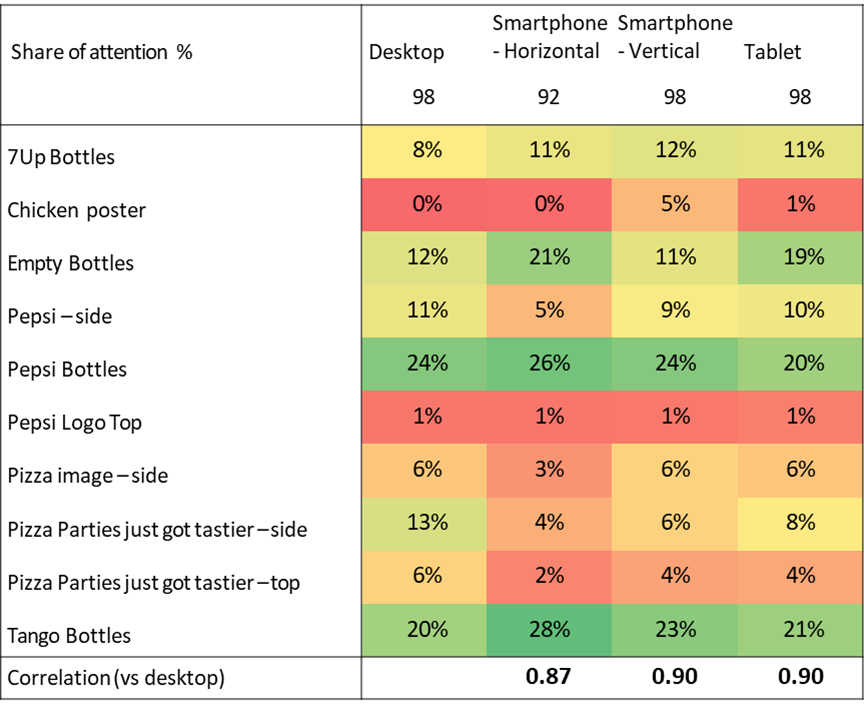
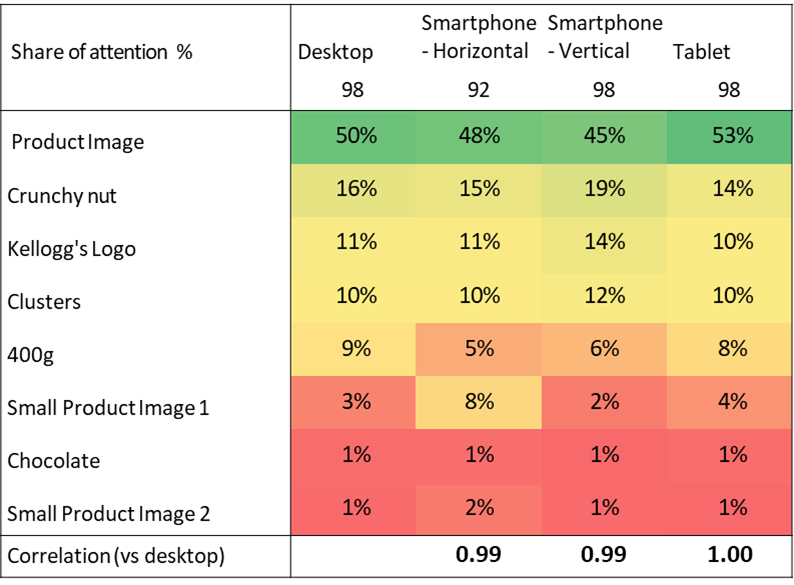
Share of attention % = aoi_fixation_total_time_spent_ms presented as a percentage of the sum of aoi_fixation_total_time_spent_ms across all AOIs for the stimulus.
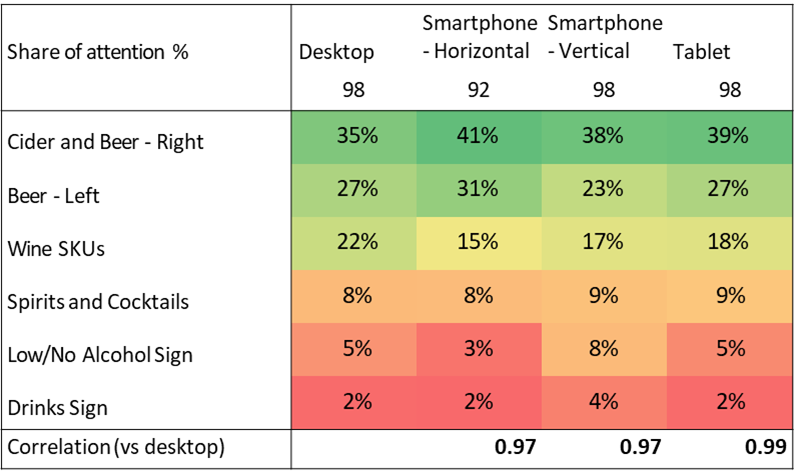
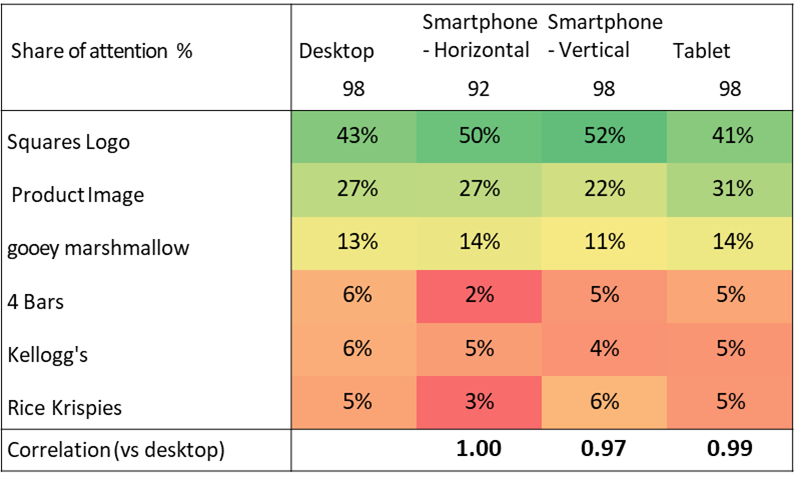
Correlation is best with Horizontal phones and tablets, worst with vertical smartphones (but still positive). Share of attention % data shows a slightly stronger correlation across device types, with horizontal and vertical smartphones correlating identically.
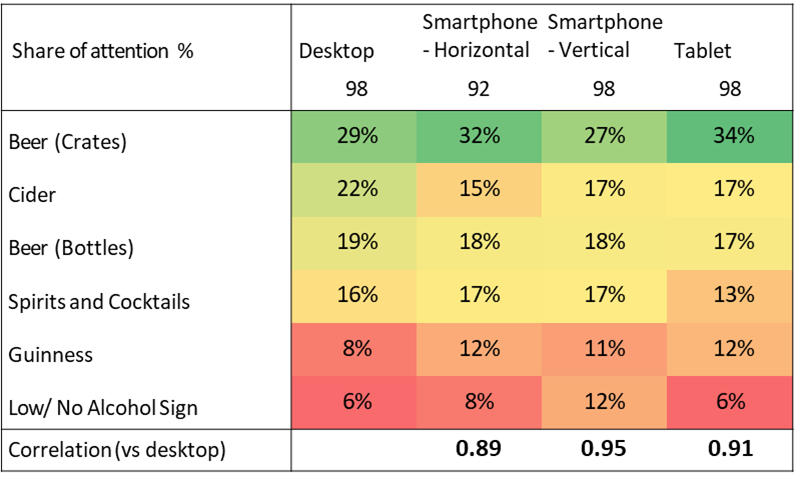
Surprisingly correlation is marginally better with horizontal smartphones vs vertical ones or tablets. However, absolute %s for vertical smartphones are closer to desktop than horizontal.
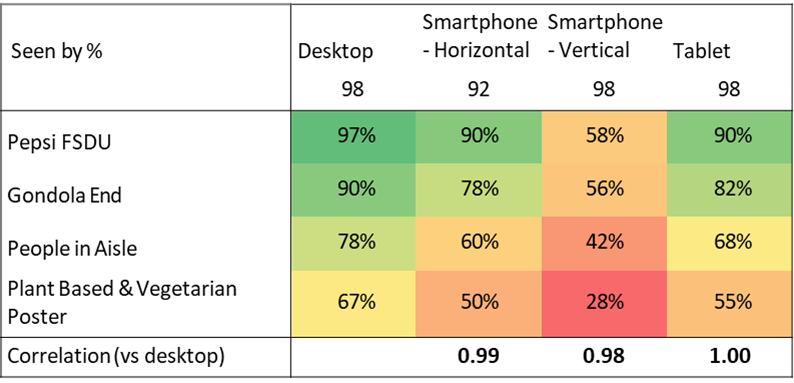
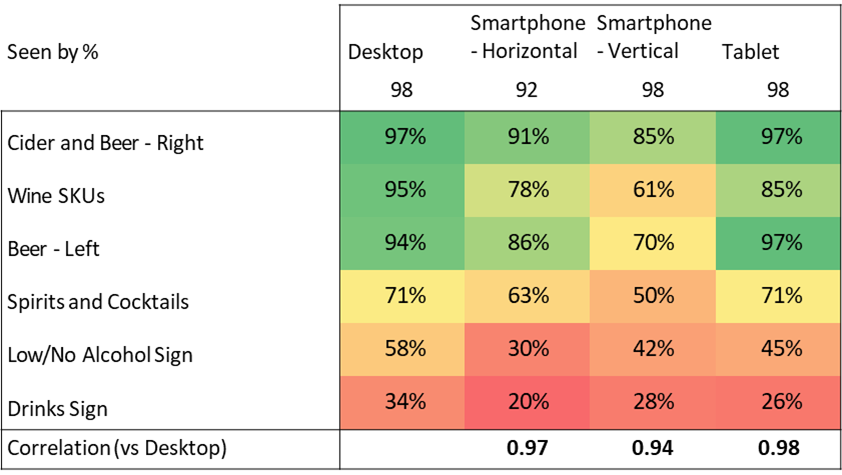
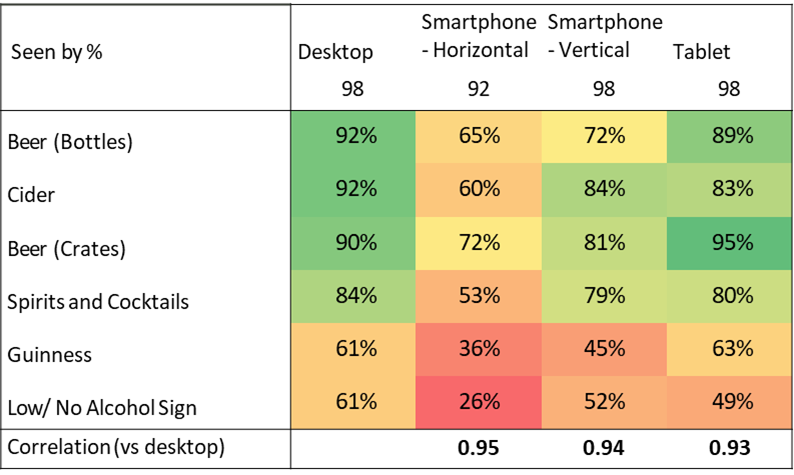
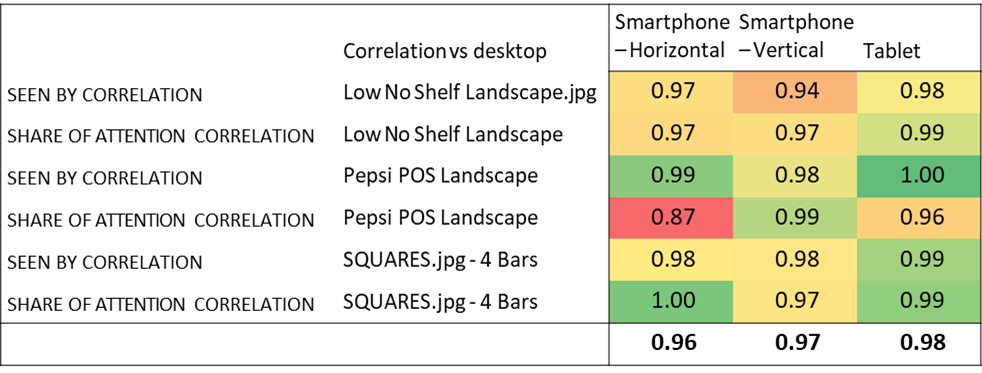
Clear AOIs provide very strong correlations, strongest on tablets. As AOIs become smaller differences increase, especially for vertical smartphones.
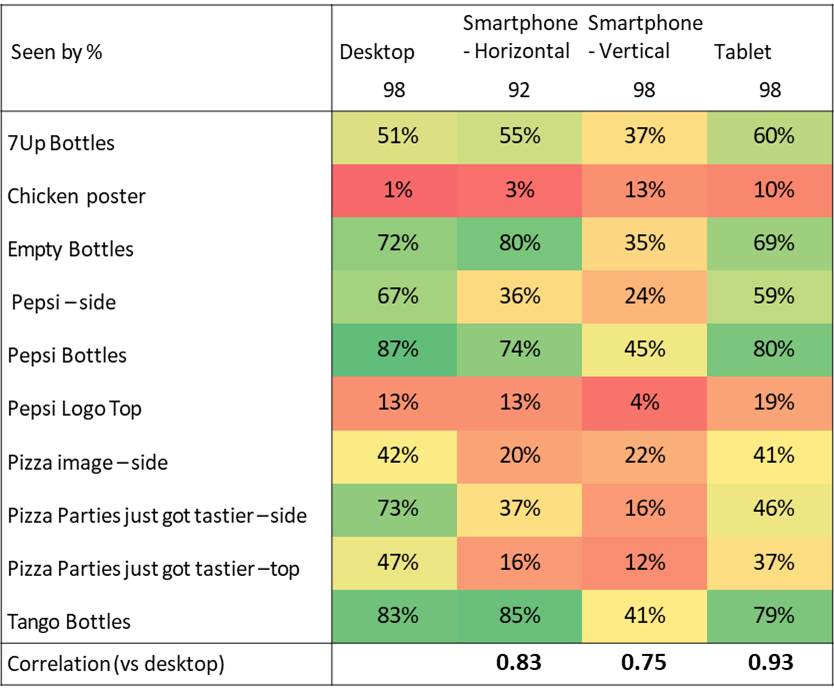
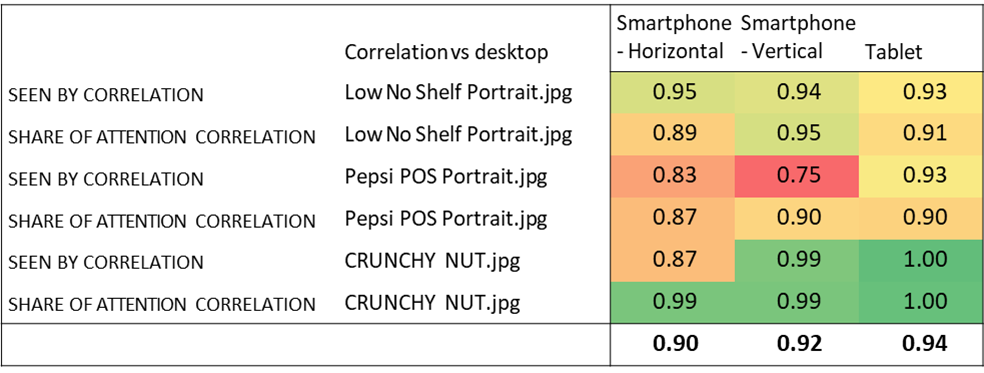
As AOIs become a little more detailed and smaller on screen there are weaker correlations. However, the horizontal orientation correlates more with desktops than vertical smartphones.

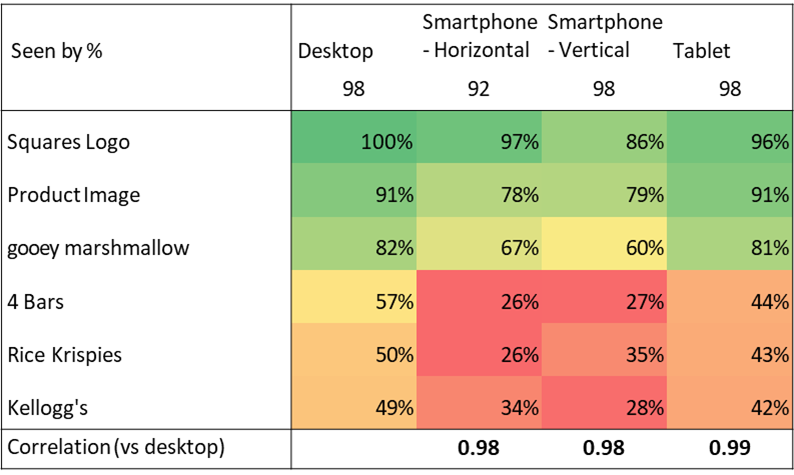
Strong correlations on all devices, with absolute numbers being closer on tablets.

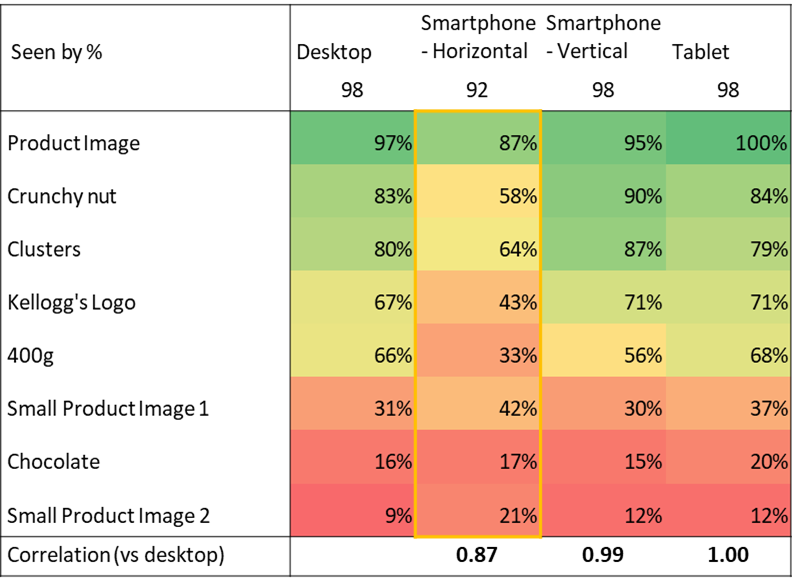
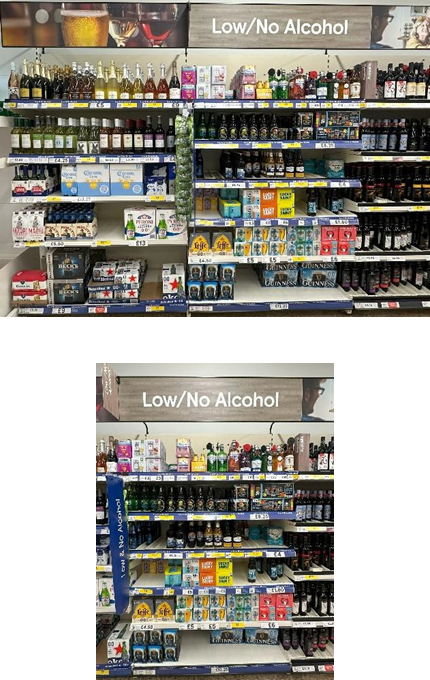
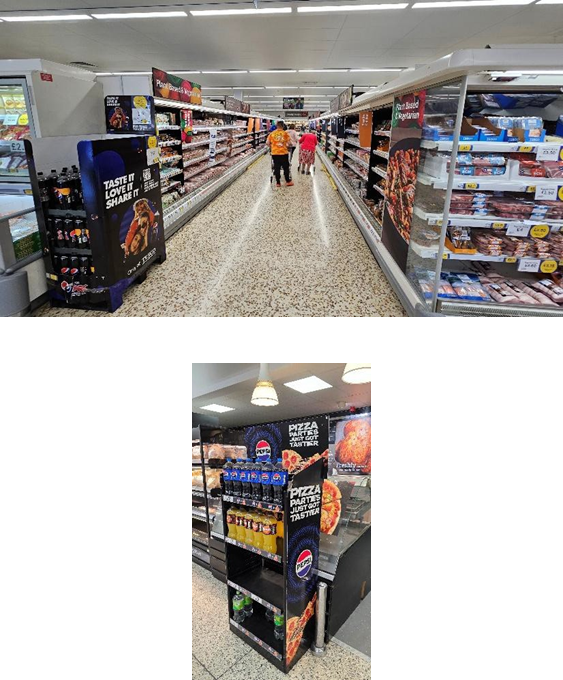
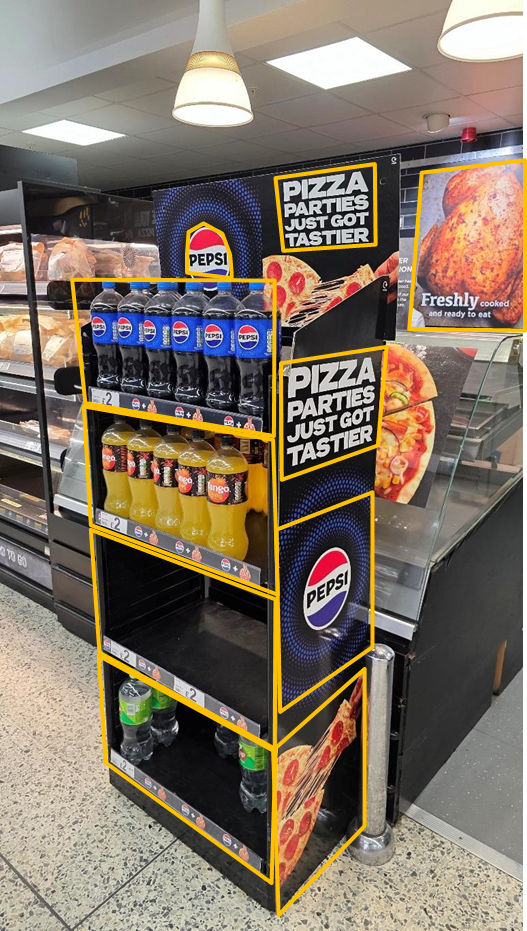
Horizontal phones appear to be a lot less compatible with vertical images, with many AOIs showing inconsistent data.
Across both Seen By (%) and Share of Attention (%) metrics:


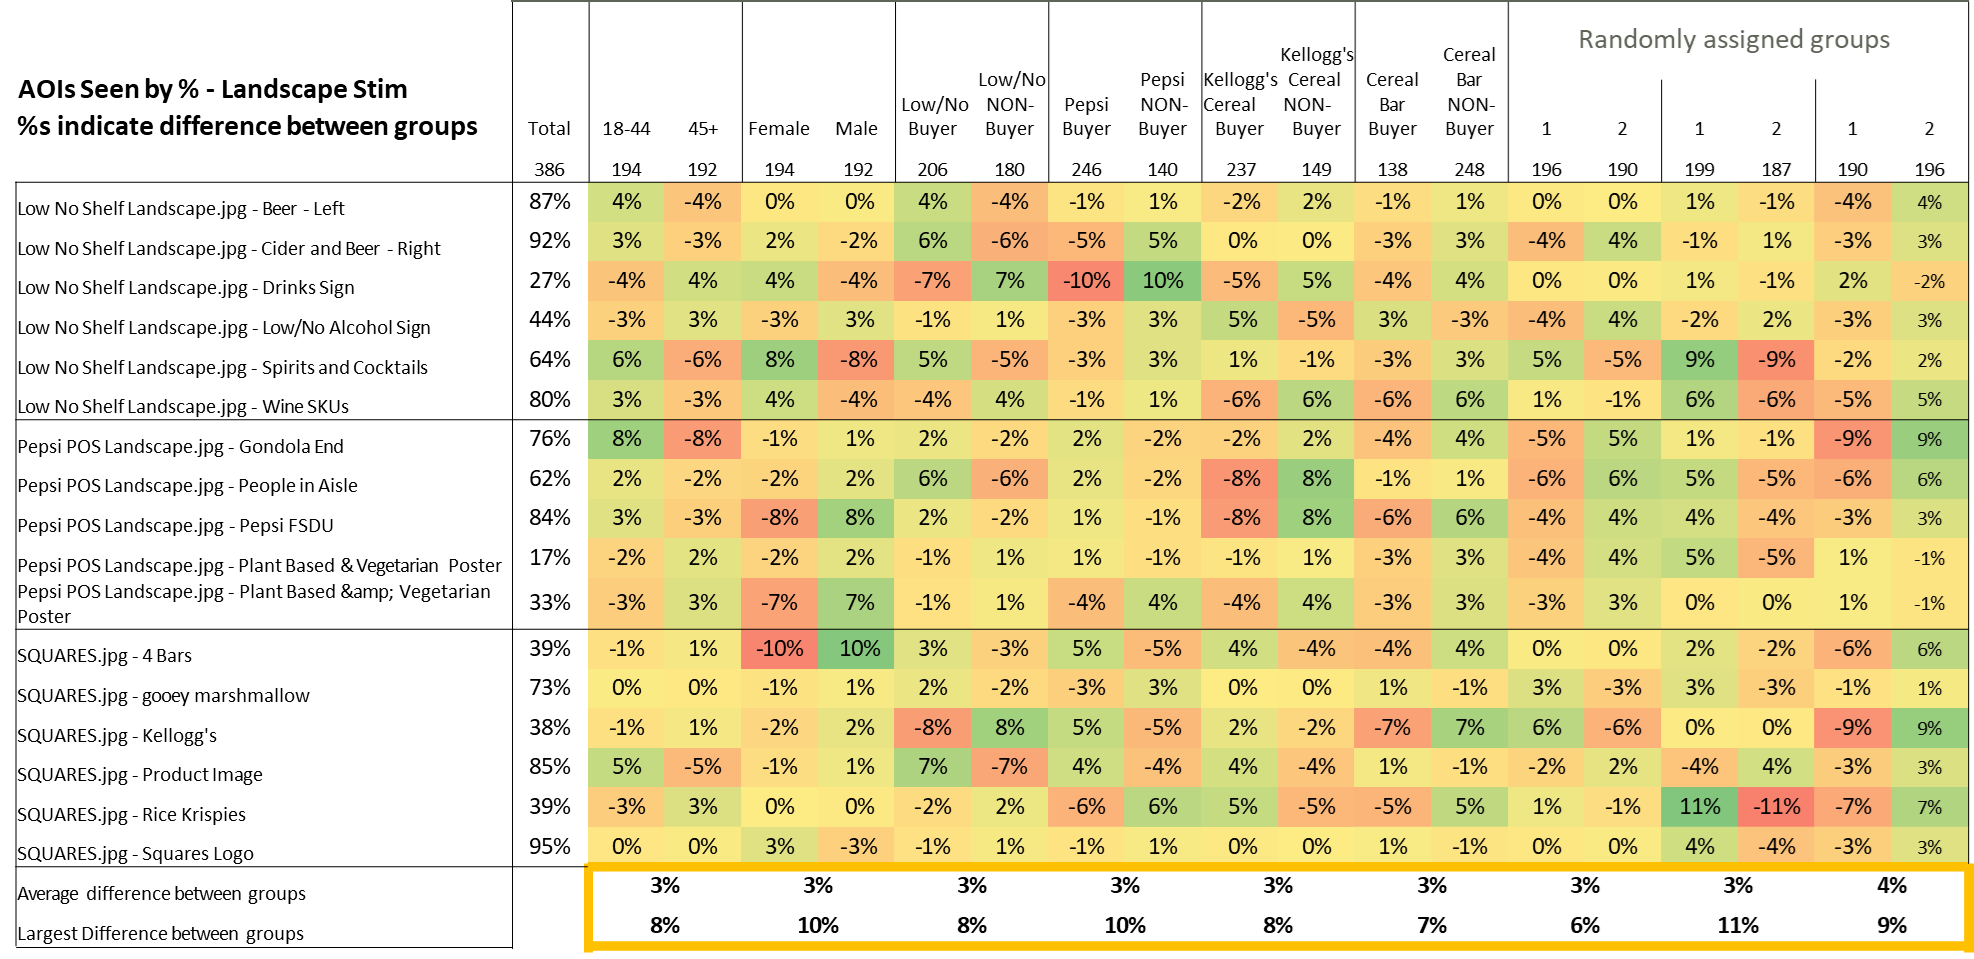
Consistently across analysis groups, the average difference is 3%, with a max of c.10% difference.
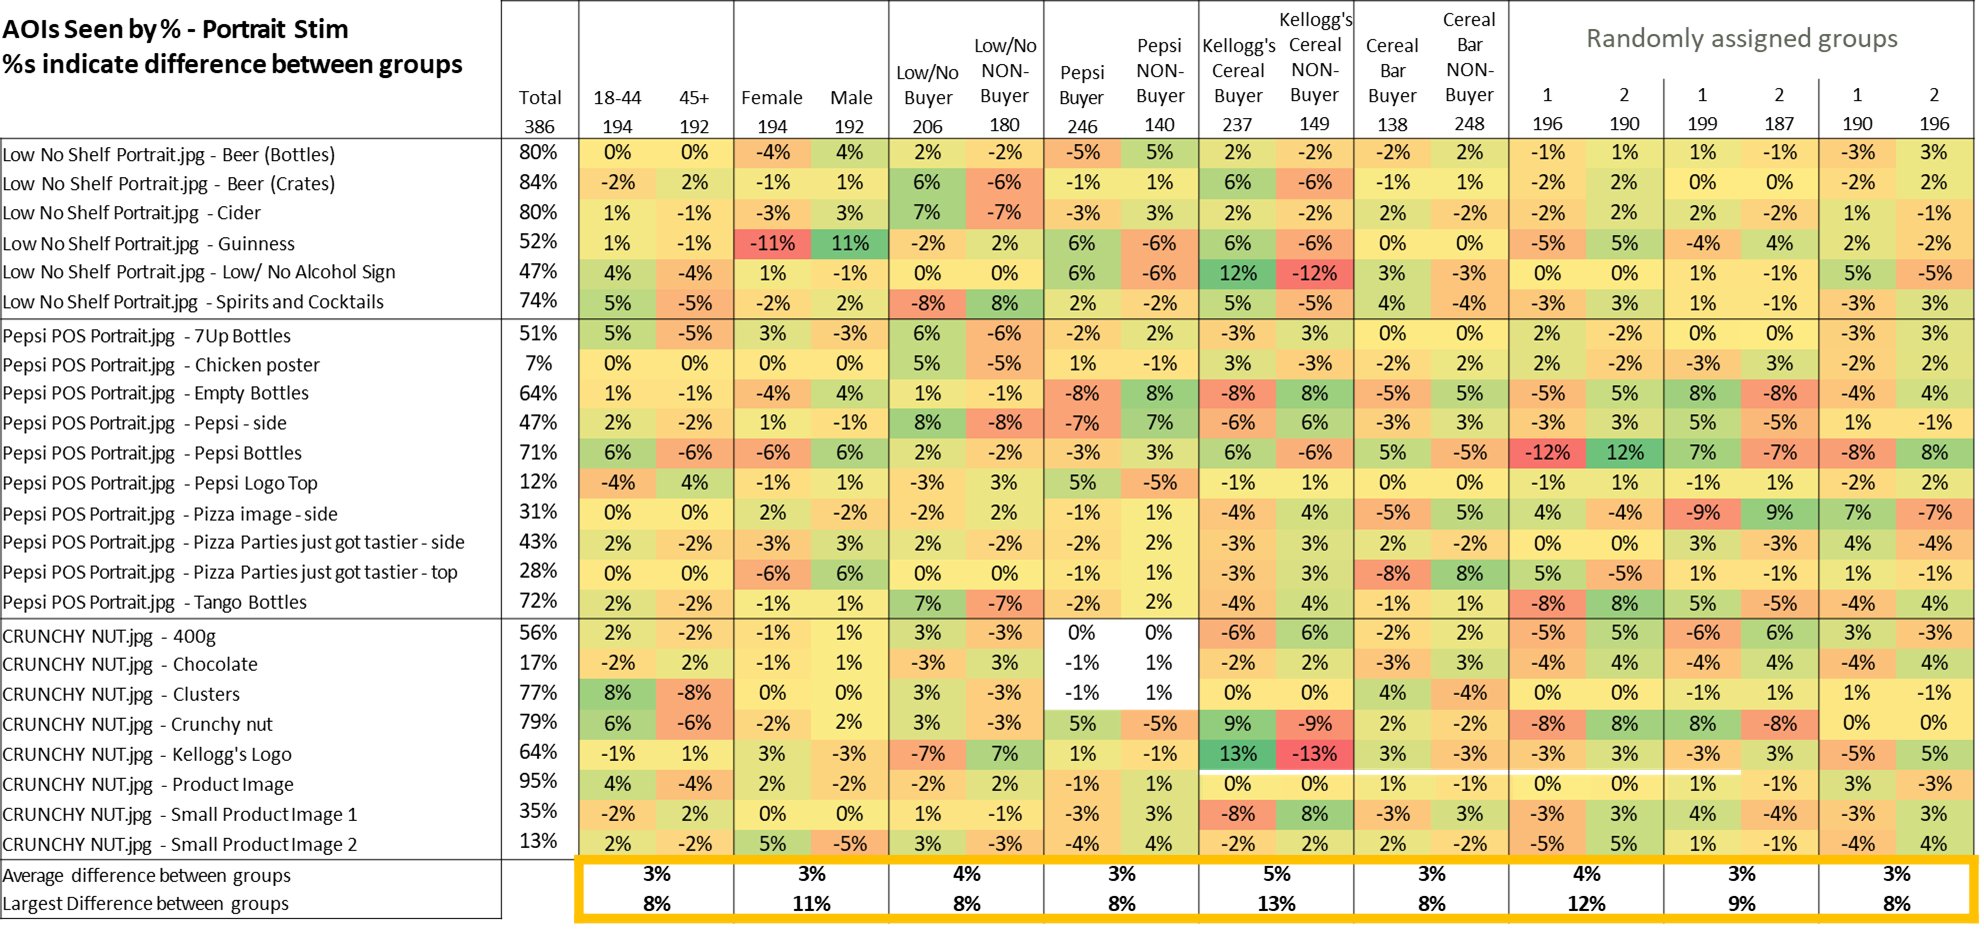
The same can be observed across portrait stimuli, with slightly higher max differences between groups.
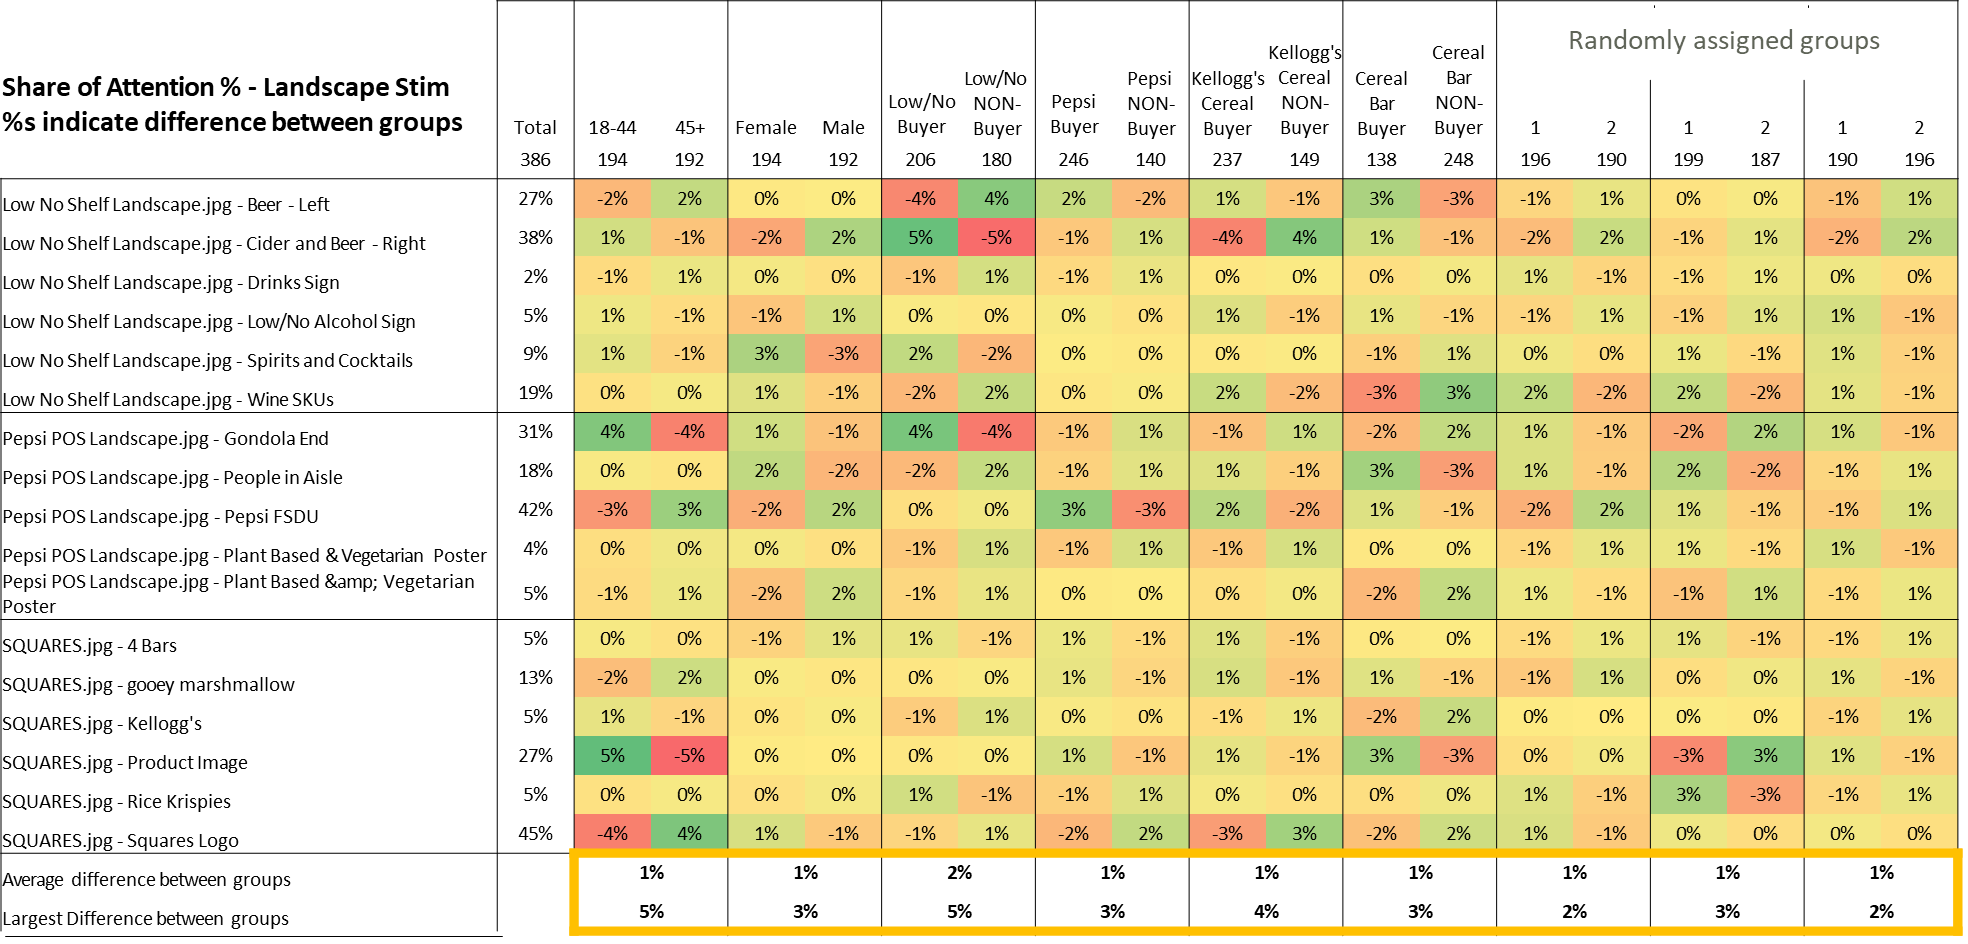
There are even smaller discrepancies when observing the differences across participant types.
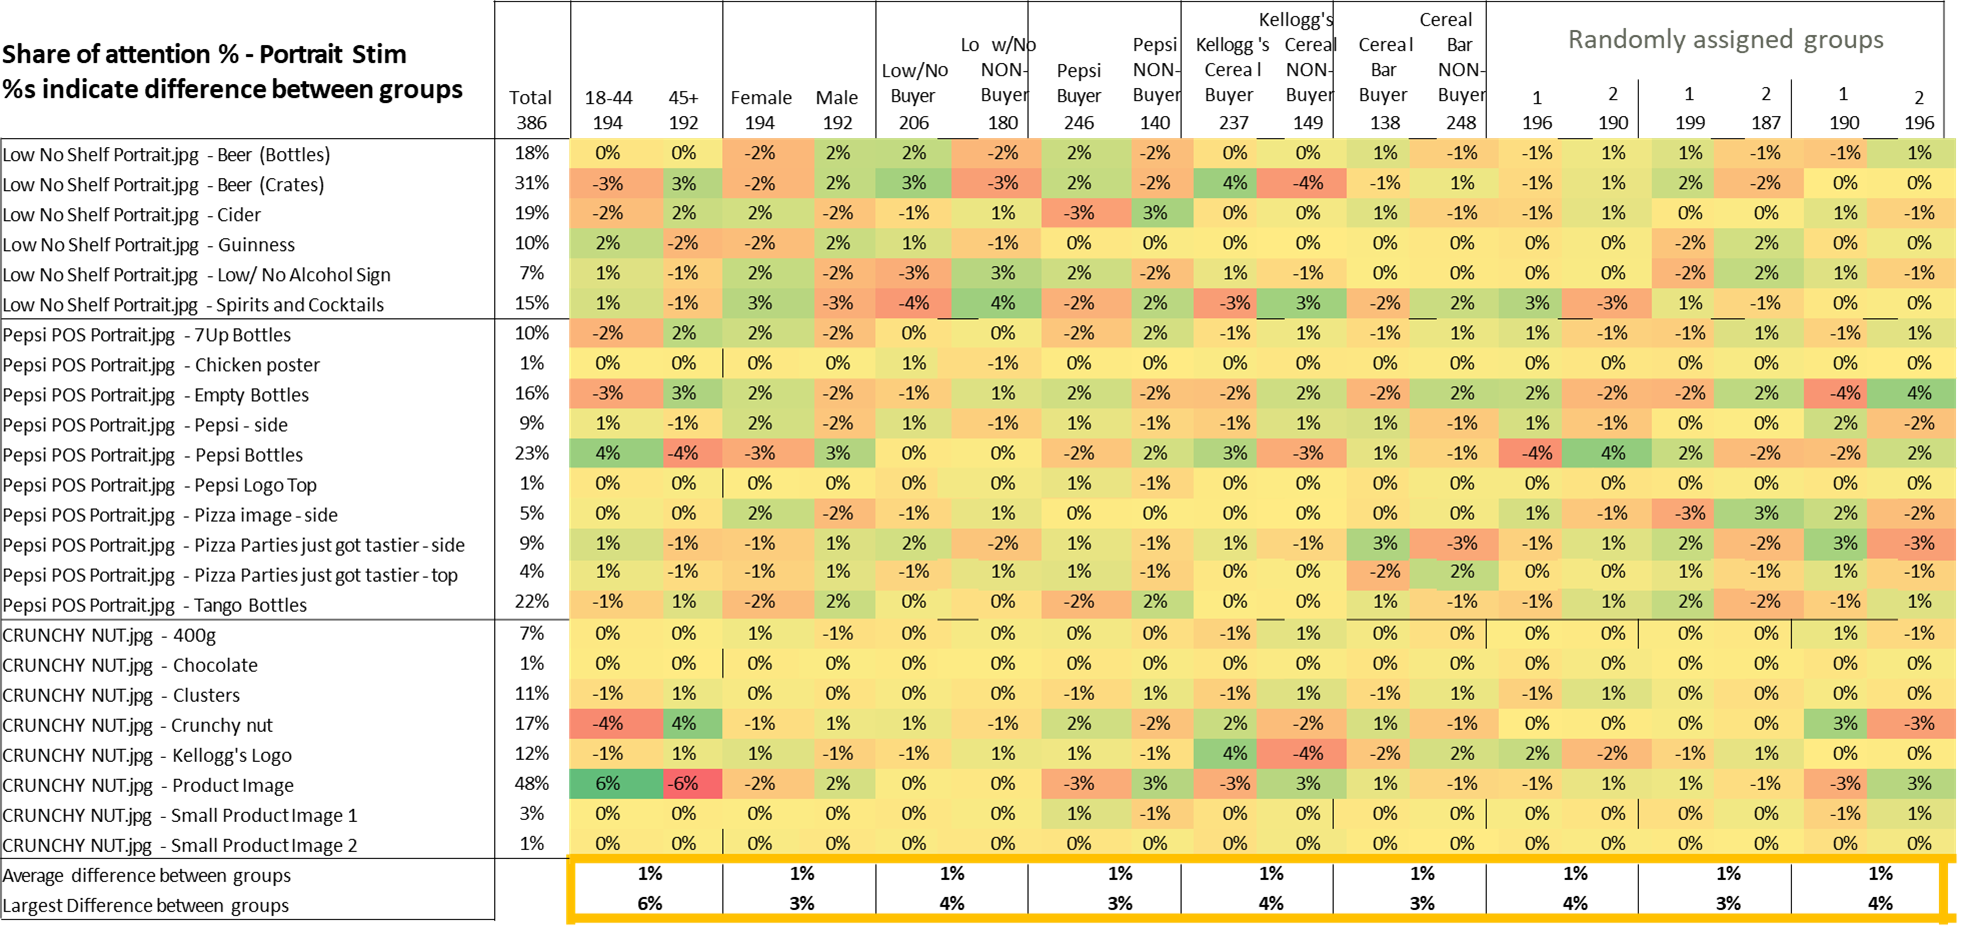
There are even smaller discrepancies when observing the differences across participant types.
This study demonstrates strong consistency in eye-tracking data across devices and participant groups. With appropriate consideration of stimulus orientation, mobile and tablet devices can be used effectively alongside desktops without detriment to insight quality.