Attention measurement with eye-tracking & K-coefficient - explained

Beata Lewandowska, Kasia Wisiecka, RealEye, SWPS
8 min read

In the neuroscience and neuromarketing world, there was an increasing demand for measuring people’s attention level when they are being exposed to certain stimuli, i.e., to an advertisement. Attention is a cognitive process that tells us about somebody’s concentration and ability to actively process specific information. Considering the advertisement example, it’s crucial to not only know what people are looking at or what emotions it evokes but also to understand consumers’ dynamic of attention.

It all started at SWPS University…

There were many attempts to create a dynamic visual attention indicator, finally a group of scientists from SWPS University (who we had the pleasure to meet and work with) succeeded in creating a K-coefficient. This parameter uses eye movement parameters (fixation duration and saccade amplitude) to define the path of attention dynamic of an examined person.

How it works

NOTE: In case you’d prefer to read the source article, please refer to: Krzysztof Krejtz, Andrew Duchowski, Izabela Krejtz, Agnieszka Szarkowska, and Agata Kopacz. 2016. Discerning Ambient/Focal Attention with Coefficient K. ACM Trans. Appl. Percept. 13, 3, Article 11 (May 2016), 20 pages. https://doi.org/10.1145/2896452

In eye-tracking research, we can distinguish two general types of visual attention: ambient and focal. Ambient attention indicates a scanning pattern over stimuli (typical for the early stages of scene perception), characterized by short duration fixations followed by long saccades. Longer fixations followed by shorter saccades, on the other hand, are indicative of focal attention. The more focal processing of the stimuli, the deeper attention is given, which can mean that someone is actively processing the information.

Both types of attention aren’t binary - it constantly interplays and shifts dynamically between ambient and focal. To show the dynamics of this process, the K-coefficient was created.

"In the calculation of K, both fixation durations and saccade amplitudes are transformed into a standard score (z-score), allowing computation of an ambient/focal attentional coefficient per individual scanpath. The transformation of raw data from saccade amplitude and fixation duration into standard scores, representing the distance between the raw score and the mean in units of the standard deviation, allows for direct mathematical comparison of both measures."

- 2016, Discerning Ambient/Focal Attention with Coefficient K

We derive K, calculated for each participant, as the mean difference between standardized values (z-scores) of each saccade amplitude (ai+1) and its preceding ith fixation duration (di):

such that

where:

  • μd, μa are the mean fixation duration and saccade amplitude,
  • σd, σa are the fixation duration and saccade amplitude standard deviations, computed over all n fixations and hence n Ki coefficients (i.e., over the entire duration of stimuli presentation).

We can now define that if a in a given moment:

  • K > 0 means relatively long fixations followed by short saccade amplitudes, indicating focal processing,
  • K < 0 means relatively short fixations followed by relatively long saccades, indicating ambient processing,
  • K = 0 indicates a rare situation, when a person exhibits long saccades preceded by long fixations or short fixations followed by short saccades.

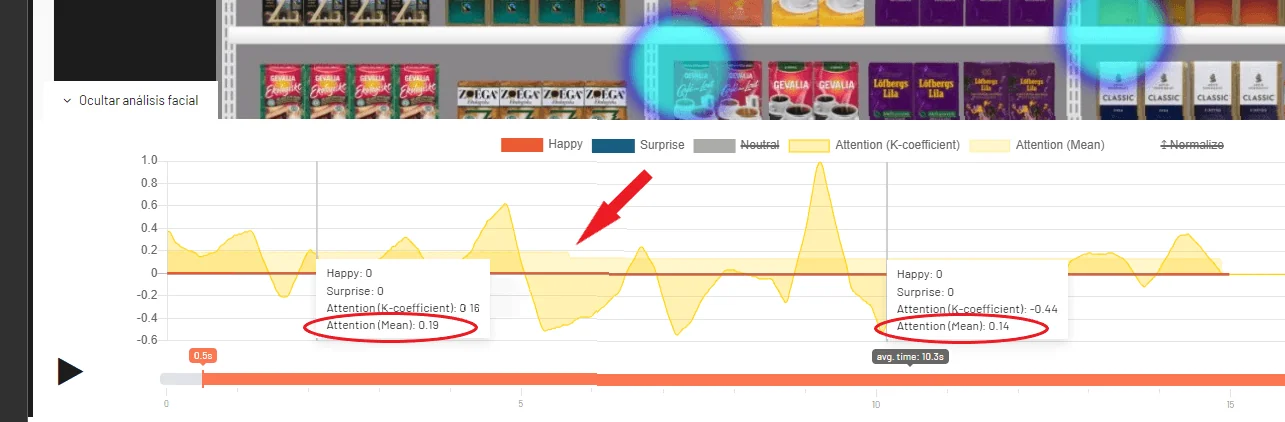
The above dependence can be observed on the study participant’s recording (data from a single participant):

Both types of attention aren’t binary - it constantly interplays and shifts dynamically between ambient and focal. To show the dynamics of this process, the K-coefficient was created.

On our platform, the mean value is calculated by sampling the K-plot every 30 ms and the arithmetic mean is calculated from those samples.

Sample use cases

A video advertisement

As mentioned previously, knowing the audience's attention level is essential while testing video ads. If, for the most viewing time, customers’ attention stays ambient, especially when they look at something else than shown branding, it can be concluded that the ad may be remembered superficially and the critical information (the main ad message) can be lost.

Let’s take a look at the Snickers ad below:

At the very beginning, the attention is ambient, which is normal, but when the brand is shown, attention switches to the focal mode, indicating that the message was well received and remembered.

Shelf testing

For the following example, we’ll stay in the marketing world. Shelf testing is commonly used to gain shopper insights and understand what grabs their attention. An interesting observation can be made: when you ask participants to choose and click a product on the shelf, the attention level goes up significantly. Therefore, the decision process is related to the level of ambient/focal attention.

The same applies to the salience methodology: when you ask study participants to press a key when they recognize a product, the attention level always goes up to 100% at the very moment of recognition, as shown below (aggregated data from 50 participants):

There is one thing worth noticing if you allow people to finish the stimuli display with a click on keypress - the mean K value can change over time:

This happens because there are different amounts of data for these fragments. If some of the participants were finishing earlier, therefore the aggregated data will be different for later parts.

Please also remember that the K factor for low-quality results may not be applicable - if fixations can’t be calculated properly, the attention level will be deceitfully lowered.

Learning process

In the case of the learning process, especially e-learning, with using the K-coefficient, you can find a moment when students/kids are overloaded to make a break from the lesson. Also, it allows you to provide more key information where they are being more focal. This approach can be executed by a teacher or automatically by a system.

Summary

Paradoxically, just because we are looking somewhere does not mean that we are seeing and actively processing. The location of gazing may be much more important in forming an interpretation when we also consider the level of attention over time, in a given area of interest. The switching from ambient to focal and from focal to ambient visual attention may tell us e.g. when clients were interested in given content and when they lost their interest.

What is a great advantage of the system is the real-time calculation of ambient/focal attention. It opens the door for developing alerts of concentration level that we can use on a daily basis.

Want to know more? Contact us!

"It’s been a pleasure working with RealEye. Their customer service is prompt, valuable, and always friendly. The quick turnarounds on custom development requests are the most impressive. The RealEye team delivers great tailored solutions. Thank you for being a wonderful partner!"

Sam Albert
Chief Digital Officer

"I'm really impressed with what Adam has created with RealEye. It's astounding how easy and fast it is to track and report on eye movement for a page or design."

David Darmanin
CEO, hotjar.com

"Webcam-based eye-tracking has vast potential within market research and RealEye made a great effort customizing their solutions to our needs. We succeeded in having live online interviews with eye-tracking included and we look forward to build on this pilot study to take further advantage of this solution in future research."

Stefan Papadakis
Insight Consultant, IPSOS
Trusted by freelancers, small to big companies, students, and universities.

Frequently Asked Questions

How accurate are the eye-tracking results?

RealEye studies are proven to be around 110 px accurate. This allows analyzing users interaction on a website with precision reaching the size of a single button.We predict the gaze point with frequency up to 60 Hz.For in-depth analysis of webcam eye-tracking accuracy check the following articles:

Who can participate in my study?

Either your own or RealEye participants. You can invite your users or panel and share the study with them using a participation link. All they need to have is a laptop/PC with a webcam.We also have a network of panelists from all over the world - mainly from the UK and the US. Randomly picked users can be assigned to your task. They are called RealEye participants. We will not show them your stimuli before the test starts, so their interaction will be natural.

Note: RealEye participants can't take part in a 'Live Website' studies and studies longer than 10 minutes. Read more about the limitations here.

Can I pay per study?

There are only monthly payments, so there’s no possibility to pay per study. But keep in mind that you can cancel your license any time (even in the same month) - you’ll keep the account access until the end of the billing period (30 days from the last payment).

Can I integrate RealEye with other tools?

You can easily integrate the RealEye tool with external tools (eg. surveys), but also compare the results obtained from other tools using our CSV file (i.e. by the timestamp).
Your browser does not support the HTML5 canvas tag.