
A study from Eastern Mediterranean University set out to find the answer - and used RealEye to help.
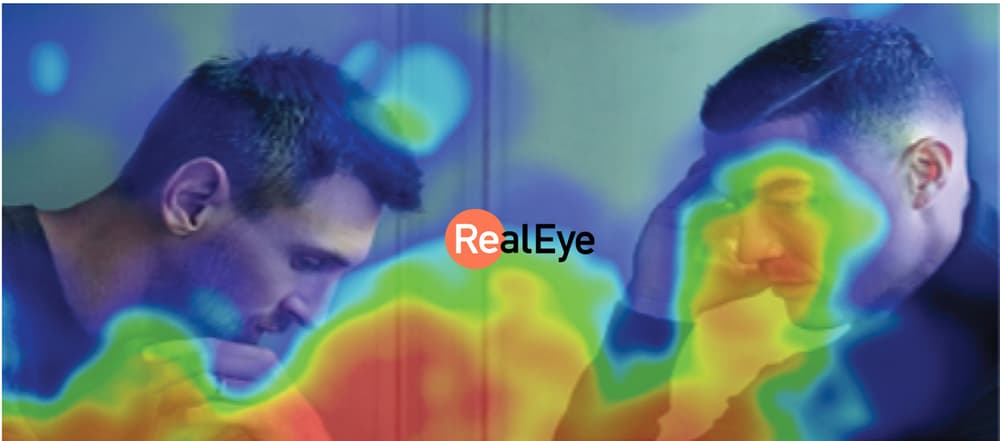
The research compared how people respond to static images (like posters) and dynamic videos (like trailers). Using RealEye’s webcam-based eye-tracking, the study measured where people looked, how long they looked, and how they felt while viewing each type of content.
Here’s how it worked - and what the results showed:
Researchers asked 15 participants to take part in a short eye-tracking experiment.
Each person viewed:
While they watched, RealEye tracked their eye movements using a webcam - no special equipment needed. It captured where people looked, for how long, and what emotions they showed, such as smiling or surprise.
The team also looked at Instagram data for 30 different movies, comparing how many likes their posters and trailers received. This helped them link what they saw in the lab to how people behave online.
RealEye made it easy for researchers to collect a range of helpful data with AOI Metrics:
All of this data was downloaded from RealEye’s dashboard and analyzed in SPSS, a statistical software tool.
Eye-Tracking Comparison

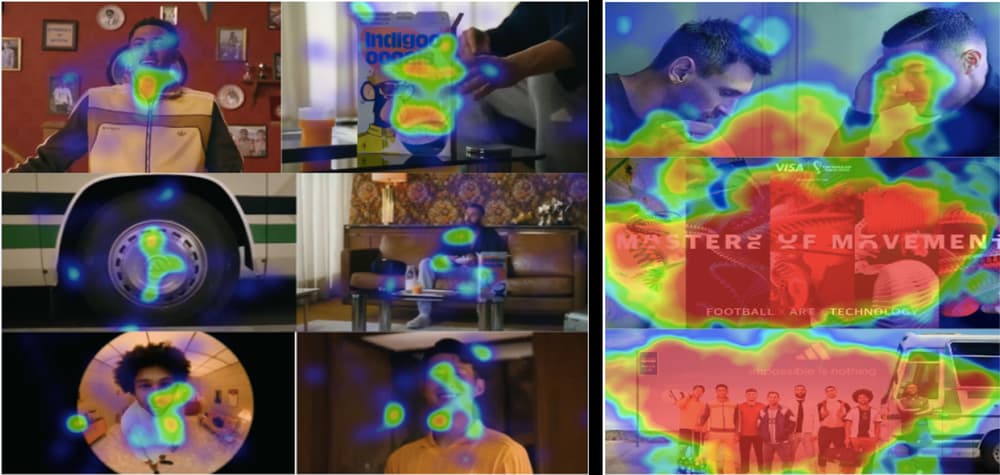
People looked more often and for longer at the video than at the posters. Even though the time they spent looking at each spot stayed the same, the video clearly held their attention better.
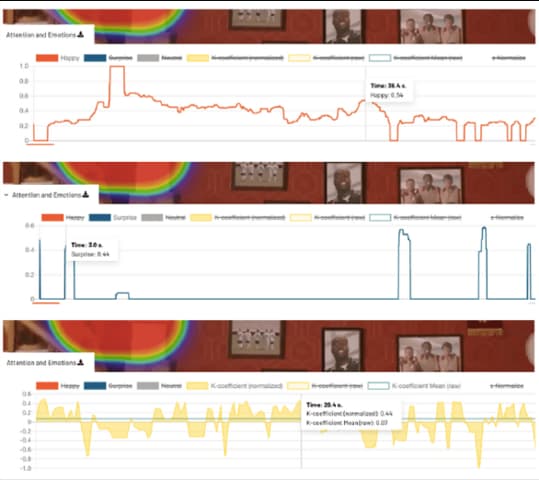
Emotional Reactions
To see if this held true outside the lab, researchers looked at Instagram likes on 30 movie posters and trailers.
On average:
Some examples:
In most cases, videos clearly outperformed images. A few exceptions— - ike Joker, where the poster got more likes - show that great design still matters. But overall, video came out ahead.
If you create content, design campaigns, or study how people interact with media, this study shows one clear thing:
Dynamic content - like video - tends to hold people’s attention better than static images.
But more importantly, with tools like RealEye, you don’t have to guess what works. You can test it, measure it, and improve it based on real user behavior.

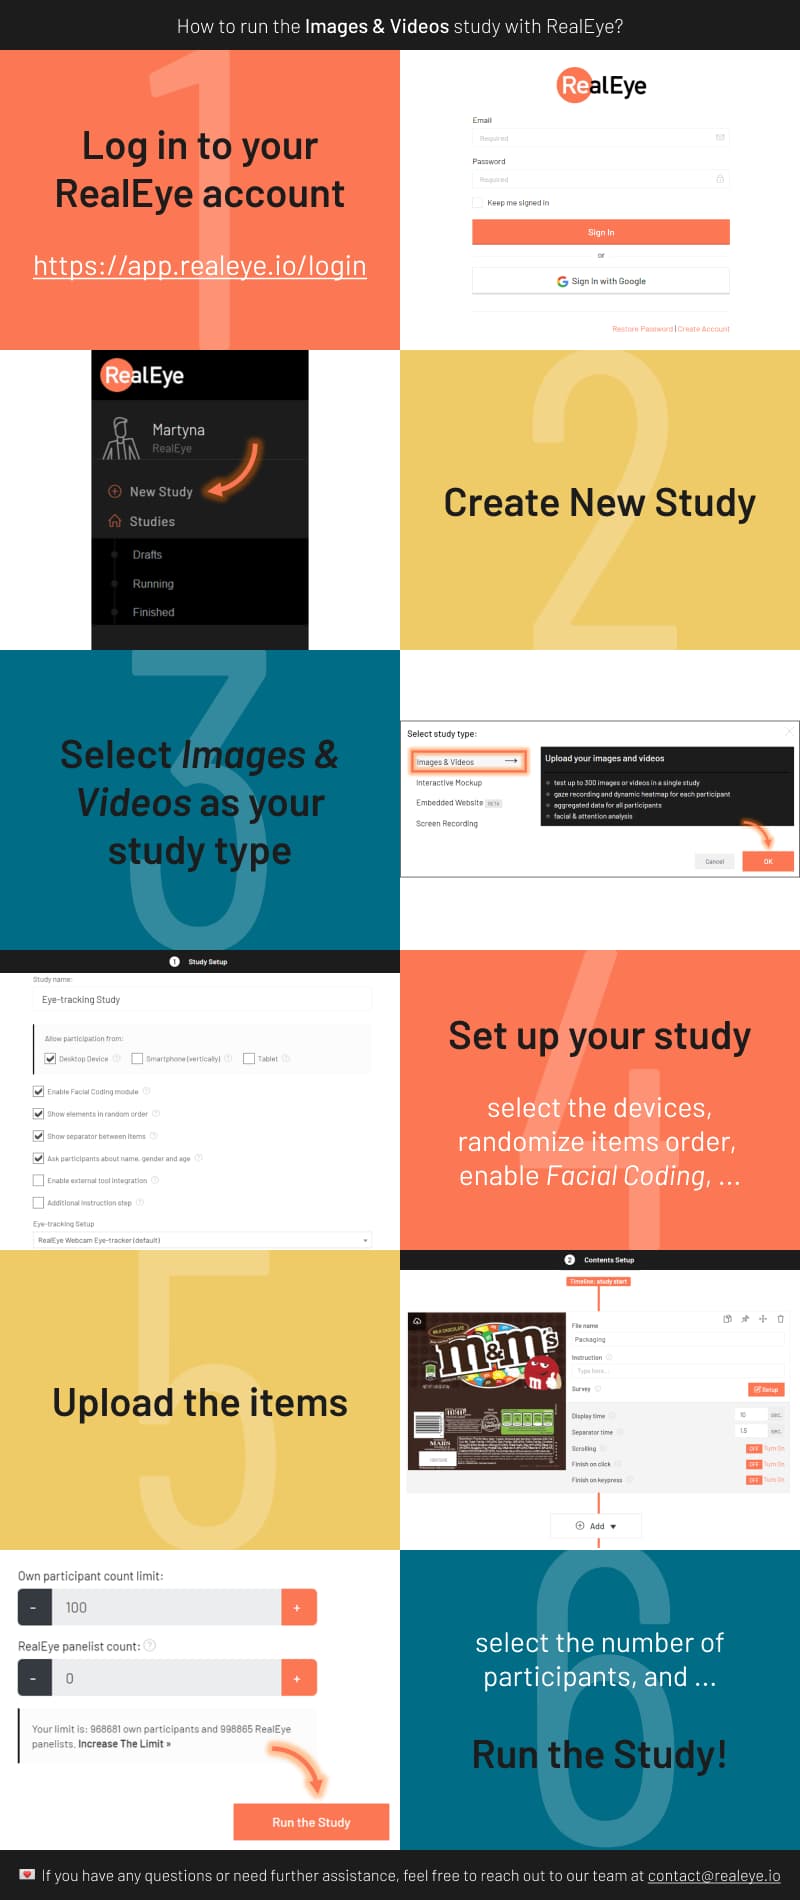
Follow the steps below to start your own experiment with RealEye:
Ready to set up your own study? Visit RealEye Support page to learn more and keep us posted on your results! 🚀